View flow logs in the Calico Whisker web console
This feature is tech preview. Tech preview features may be subject to significant changes before they become GA.
You can observe network traffic in your cluster by viewing flow logs in the Calico Whisker web console.
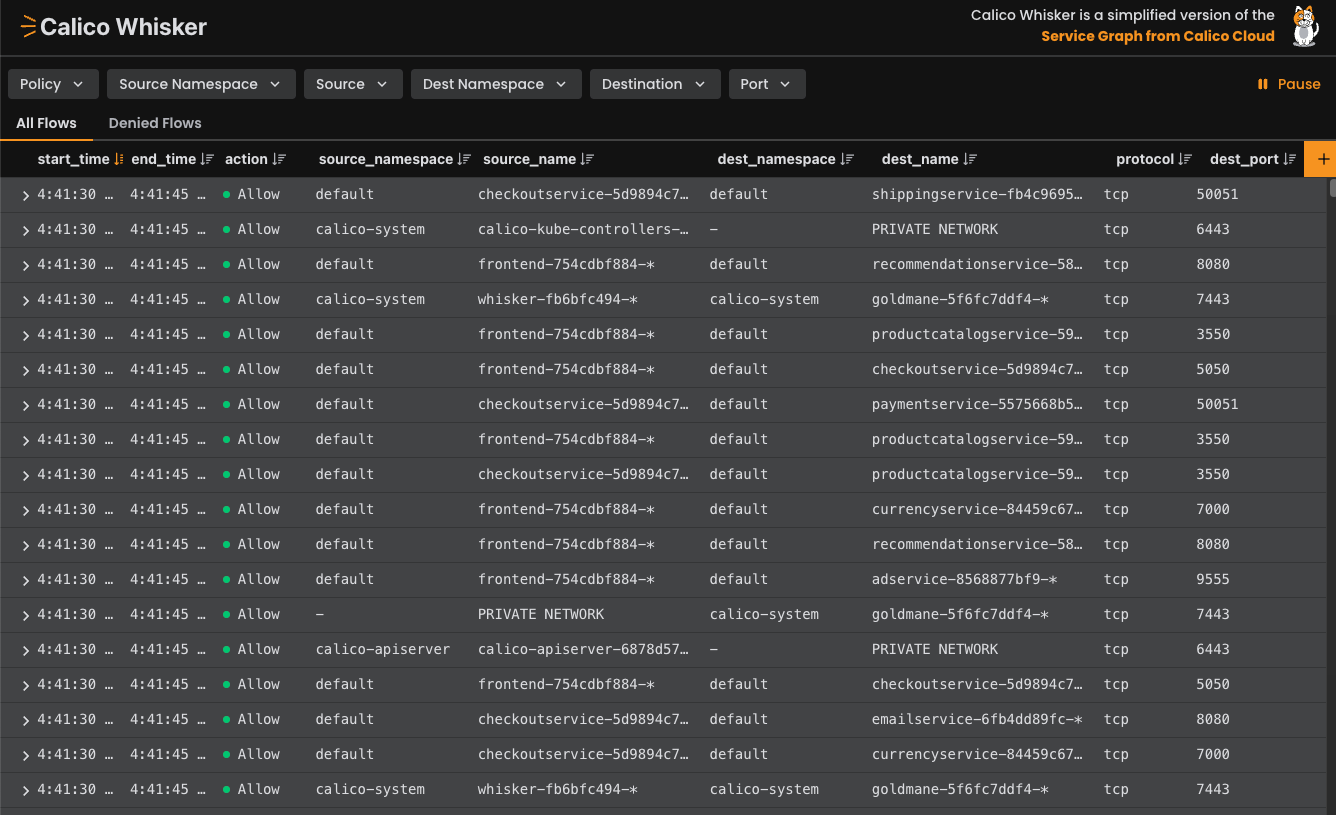
Figure 1. A view of the Calico Whisker web console showing flow logs in a Kubernetes cluster.
About flow logs in Calico Open Source
Tracking network activity in your cluster is essential for understanding how your applications communicate. Calico helps you see your network activity by processing your network connections and recording them in a digestible format called a flow log.
A flow log is an aggregation of connection data that matches the same set of criteria (i.e., source, destination, policies) across your cluster over a period of time. Flow logs don't record every single network connection that takes place in your cluster. Rather, they represent a type of network flow that occurs in your cluster. Imagine, for example, that your cluster has 1000 individual network connections that take place within 1 minute. It would be difficult to sort through those 1000 connections, and more difficult to understand what they mean. But the corresponding flow logs for that minute might turn those 1000 entries into 15 flow logs, each representing a distinct type of connection (pod A to pod B, public internet to pod C), but without the duplicate flow type entries. This way, you can understand the overall network activity without being overwhelmed by the sheer volume of data.
Using flow logs
Flow logs are useful for a variety of purposes, including:
- Network visibility. Understanding traffic patterns within the cluster, between namespaces, and to or from external services.
- Troubleshooting connectivity issues. If pods aren't communicating, flow logs can show if traffic is being denied by policy or if it's actually reaching the destination.
- Security. Detecting policy violations (unexpected deny logs), identifying anomalous traffic patterns (e.g., unusually high data transfer), and investigating potential security incidents.
- Policy validation. Confirming that network policies are working as intended (allowing expected traffic, denying forbidden traffic). This is especially useful for testing out staged network policies before moving them to production.
Calico Whisker
The Calico Whisker web console is a browser-based interface that shows you a stream of flow logs from your cluster in real time. While the console is open, it receives live data from a dedicated flow logs API (Goldmane). You can filter the stream to see only the logs for a particular policy, namespace, pod, or other criteria.
Flow log data types
The following table describes the flow log data types used by Calico Whisker.
| Name | Datatype | Description |
|---|---|---|
start_time | date | Start time of log collection in Unix timestamp format. |
end_time | date | End time of log collection in Unix timestamp format. |
action | keyword | - allow: Calico accepted the flow.- deny: Calico denied the flow. |
bytes_in | long | Number of incoming bytes within the timeframe. |
bytes_out | long | Number of outgoing bytes within the timeframe. |
dest_name | keyword | Contains one of the following values: - Name of the destination pod. - Name of the pod that was aggregated or the endpoint is not a pod. |
dest_namespace | keyword | Namespace of the destination endpoint. A - means the endpoint is not namespaced. |
dest_port | long | Destination port. Not applicable for ICMP packets. |
dest_labels | array of keywords | Labels applied to the destination pod. |
reporter | keyword | - src: flow came from the source that initiated the connection.- dst: flow came from the destination that received the initial connection. |
packets_in | long | Number of incoming packets within the timeframe. |
packets_out | long | Number of outgoing packets within the timeframe. |
protocol | keyword | Protocol. |
policies | array of arrays | List of policies that interacted with this flow. |
source_name | keyword | Contains one of the following values: - Name of the source pod. - Name of the pod that was aggregated or the endpoint is not a pod. Check source_name_aggr for more information, such as the name of the pod if it was aggregated. |
source_namespace | keyword | Namespace of the source endpoint. A - means the endpoint is not namespaced. |
source_labels | array of keywords | Labels applied to the source pod. A hyphen indicates aggregation. |
Viewing flow logs
You can quickly and securely view flow logs by port forwarding the Calico Whisker web console to your workstation. By default, Whisker does not automatically expose an endpoint.
Calico creates network policies to deny ingress traffic to Calico Whisker by default. If you want to expose Calico Whisker by a method other than port forwarding, then you must create new network policies to allow that traffic.
Calico Whisker and Goldmane contain sensitive network and workload data. You should not expose this data externally without additional security.
One method to securely expose these services is to use Calico Ingress Gateway with an authentication layer.
View flow logs in the web console
Port forwarding the Whisker service is a simple and secure method to view your flow logs.
Prerequisites
- You have local
kubectlaccess to a Kubernetes cluster with Calico installed. - You installed Calico Open Source using the operator method or with Helm. Manifest installations are not supported. (But you can convert a manifest installation to an operator installation.)
- Calico Whisker and the flow logs API are enabled on your cluster. For new installations, they're both enabled by default. If you upgraded from Calico Open Source 3.29 or earlier, you need to enable them manually.
Procedure
-
Port forward the Calico Whisker web console to your workstation:
kubectl port-forward -n calico-system service/whisker 8443:8443Expected outputForwarding from 127.0.0.1:8443 -> 8443Forwarding from [::1]:8443 -> 8443 -
To open Calico Whisker, open your browser and go to
https://localhost:8443. Calico Whisker uses a self-signed certificate, so your browser shows a security warning the first time. Accept the warning to continue. The flow table populates as Whisker receives data, filling in within a few moments.
Expose the web console with Calico Ingress Gateway
Port forwarding is fine for a quick look, but it only works from a workstation with kubectl access. To give a team a stable URL, expose Whisker through Calico Ingress Gateway. The operator creates the Gateway, the route to Whisker, and a TLS certificate for the hostname you choose, and it removes them again when you turn the feature off.
Prerequisites
- Calico Ingress Gateway is enabled, which means a
GatewayAPIresource exists on the cluster. See Create an ingress gateway. - On bare metal clusters, an IP pool is available for the gateway's load balancer address.
Procedure
-
Set a hostname on the
Whiskerresource:kubectl patch whisker default --type merge \-p '{"spec":{"ingressGateway":{"hostname":"whisker.example.com"}}}'To place the Gateway in a namespace of your choosing, add
gatewayNamespace. The operator creates the namespace if it does not exist:spec:ingressGateway:hostname: whisker.example.comgatewayNamespace: my-gateway-namespaceIf your
GatewayAPIresource defines more than one gateway class, also setgatewayClassNameto choose one. -
Wait for the Gateway to be programmed and read its address. The Gateway is in
calico-systemunless you setgatewayNamespace:kubectl get gateway -n calico-system calico-whisker-gatewayExpected outputNAME CLASS ADDRESS PROGRAMMEDcalico-whisker-gateway tigera-gateway-class <IP Address> True -
Point your hostname at that address in DNS, then open
https://whisker.example.comin your browser. The gateway serves a self-signed certificate, so your browser shows a security warning the first time. Accept the warning to continue.
Calico Whisker and Goldmane contain sensitive network and workload data. Anyone who can reach the gateway hostname can read your flow logs. Do not expose it externally without putting your own authentication in front of it.
While spec.ingressGateway is set, Calico restricts which pods may reach Whisker: only this gateway's proxy pods are allowed in. Removing the field deletes everything the operator created for the gateway:
kubectl patch whisker default --type json \
  -p '[{"op":"remove","path":"/spec/ingressGateway"}]'
Additional resources
- To use flow logs in your own scripts or applications, see Flow logs API.
- For more free observability tools, try Calico Cloud Free Tier.
- How to get started with Calico Observability features blog.
- Click here to try Kubernetes observability in your browser right now.
- Learn everything about Calico Whisker from this video presentation.